第四章 进阶语法 v1.0
第一部分 异常处理
一、错误
type error interface {
    Error() string
}
任何实现了 Error 方法的类型都可以被视为一个错误。
// Go 标准库提供了errors包来创建基本的错误
import "errors"
err := errors.New("an error")// 自定义的错误类型
type MyError struct {
Code int
Message string
}
// MyError 实现了 error 接口,被视为一个错误
func (e *MyError) Error() string {
return fmt.Sprintf("Code: %d, Message: %s", e.Code, e.Message)
}二、错误链
1.关联错误链
// 在fmt.Errorf中使用%w关键字关联到错误链中
if err != nil {
  return fmt.Errorf(“error: %w”, err)  //err为关联的错误
}
2.错误的判定与转换
// 判定错误链上的所有错误是否含特定错误
errors.Is(err, fs.ErrXxx)err := processRequest()
var targetErr *MyError
if errors.As(err, &targetErr) { // 存在错误则转换并处理,否则作为通用错误处理
fmt.Println("The error is of type *MyError")
}第二部分 并发编程
一、协程
1.创建
go func(){...} // 通过在调用函数前加go关键字实现协程的创建2.协程间通信
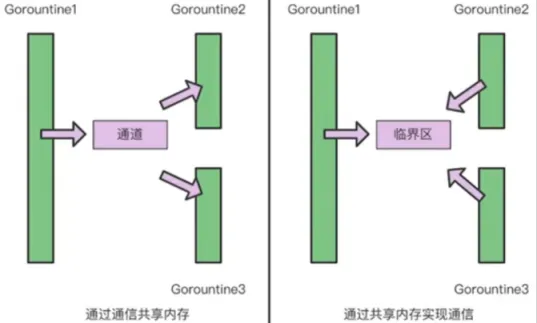
Go提倡通过通信共享内存而不是通过共享内存实现通信
3.执行等待
为了防止协程的执行因为主线程执行完毕而提前结束,需要进行线程的执行等待
使用 sync包 的 WaitGroup 类:
var wg sync.WaitGroup  // 创建对象
wg.Add(n)  // 添加计数器,使其初始数值为n
go func() {
  defer wg.Done()  // 最后执行wg.Done(),计数器减1
  ...
}()
wg.Wait()  // 等待结束(阻塞直至计数器归零)
WaitGroup中的主要方法
| 方法 | 作用 |
|---|---|
| Add(delta) | 计数器+delta |
| Done() | 计数器-1 |
| Wait() | 主进程阻塞直至计数器为零 |
二、通道
类似于一个固定长的可共享的容器,可以通过for循环range遍历
1.有缓冲通道与无缓冲通道
有缓冲通道一般用于在执行复杂操作时进行缓冲防止生产者产生速率因此受到影响而阻塞。
无缓冲通道一般用于后续操作无复杂操作时的共享内存。
2.创建
channel := make(chan 元素类型)            //创建无缓冲通道
channel := make(chan 元素类型, 缓冲大小)   //创建有缓冲通道
3.基本使用
channel <- 待进入通道的变量 // 此操作将变量放入通道,当无缓存空间时阻塞,直到有接收操作接收value := <- channel // 从通道接收数据4.关闭
通道关闭后不能再向通道发送数据,但可以继续接收数据,直到通道为空
close(channel)5.等待多个通道
使用 select语句 可以同时等待多个通道操作,在其中一个接收到数据时进行操作
func main() {
    ch1 := make(chan int)
    ch2 := make(chan int)

    go func() {
        time.Sleep(2 * time.Second)
        ch1 <- 1
    }()

    go func() {
        time.Sleep(1 * time.Second)
        ch2 <- 2
    }()

    for i := 0; i < 2; i++ {
        select {
        case val := <-ch1:
            fmt.Println("Received from ch1:", val)
        case val := <-ch2:
            fmt.Println("Received from ch2:", val)
        }
    }
}
第三部分 测试
一、Golang测试框架
Go语言提供了内置的测试框架,使得编写和运行单元测试变得非常简单和高效
1.基本概念
测试文件:
- 测试文件:所有文件以
_test.go结尾 - 单元测试函数:函数名称必须以
Test开头,函数签名写为func TestXxx(t *testing.T) - 基准测试函数:函数名称必须以
Benchmark开头,函数签名写为func BenchmarkXxx(b *testing.B)
测试包:
testing包:提供了编写测试所需的基本功能testing.T类型:用于管理单元测试状态和支持格式化测试日志testing.B类型:用于管理基准测试状态和支持格式化基准测试日志testing.M类型:用于管理测试,提供了运行所有测试和获取测试结果的方法
2.TestMain
一个特殊的函数,用于在运行所有测试之前和之后执行一些设置和清理操作,函数签名写为
func TestMain(m *testing.M)
TestMain 函数通常用于以下场景:
- 设置全局状态:在所有测试运行之前进行一些全局状态的初始化。
- 清理操作:在所有测试运行之后进行一些清理操作。
- 自定义测试运行逻辑:可以在运行测试之前或之后执行一些自定义逻辑。
func TestMain(m *testing.M) {
    fmt.Println("Setup before running tests")   // 在运行测试之前执行的初始化操作
    exitCode := m.Run()                         // 运行所有测试
    fmt.Println("Cleanup after running tests")  // 在运行测试之后执行的清理操作
    os.Exit(exitCode)                           // 使用测试的退出码退出
}
3.运行测试
go testgo test -bench=.go test -run ^Test.*Case$ # 指定运行符合正则表达式函数名的函数
go test test # 指定测试文件目录运行4.测试覆盖率
go test -covergo test -coverprofile=coverage.out # 运行测试并生成一个详细的覆盖率报告文件
go test -coverprofile=coverage.out -coverpkg=./pkg/... # 指定生成一个详细的覆盖率报告文件,并指定检测覆盖率的代码目录
go tool cover -func=coverage.out # 在命令行中查看覆盖率摘要
go tool cover -html=coverage.out # 在HTML中查看覆盖率摘要
go tool cover -html=coverage.out -o coverage.html # 在HTML中查看覆盖率摘要并保存指定文件二、单元测试
testing.T 是用于编写单元测试的类型。它提供了一些方法来记录测试失败、跳过测试以及输出日志信息。每个测试函数都会接收一个 *testing.T 类型的参数。
func TestAdd(t *testing.T) {
    result := Add(2, 3)
    expected := 5
    if result != expected {
        t.Errorf("Add(2, 3) = %d; want %d", result, expected)
    }
}
常用方法
| 方法名 | 作用 |
|---|---|
Error(args ...interface{}) | 输出错误信息并标记测试失败,但继续执行测试 |
Errorf(format string, args ...interface{}) | 格式化输出错误信息并标记测试失败,但继续执行测试 |
Fail() | 标记测试失败并立即终止测试 |
Fatal(args ...interface{}) | 格式化输出错误信息并标记测试失败,立即终止测试 |
Log(args ...interface{}) | 输出日志信息 |
Logf(format string, args ...interface{}) | 格式化输出日志信息 |
Skip(args ...interface{}) | 输出跳过测试的信息并标记测试为跳过 |
SkipNow() | 标记测试为跳过并立即终止测试 |
Skipf(format string, args ...interface{}) | 格式化输出跳过测试的信息并标记测试为跳过 |
三、基准测试
testing.B 是用于编写基准测试的类型。它提供了一些方法来控制基准测试的执行次数和记录基准测试的结果。每个基准测试函数都会接收一个 *testing.B 类型的参数。
func BenchmarkAdd(b *testing.B) {
    for i := 0; i < b.N; i++ {
        Add(2, 3)
    }
}
常用方法
| 方法名 | 作用 |
|---|---|
func (b *B) Error(args ...interface{}) | 输出错误信息并标记基准测试失败,但继续执行基准测试 |
func (b *B) Errorf(format string, args ...interface{}) | 格式化输出错误信息并标记基准测试失败,但继续执行基准测试 |
func (b *B) Fail() | 标记基准测试失败,但继续执行基准测试 |
func (b *B) FailNow() | 标记基准测试失败并立即终止基准测试 |
func (b *B) Fatal(args ...interface{}) | 输出错误信息并标记基准测试失败,立即终止基准测试 |
func (b *B) Fatalf(format string, args ...interface{}) | 格式化输出错误信息并标记基准测试失败,立即终止基准测试 |
func (b *B) Log(args ...interface{}) | 输出日志信息 |
func (b *B) Logf(format string, args ...interface{}) | 格式化输出日志信息 |
func (b *B) ResetTimer() | 重置计时器 |
func (b *B) StartTimer() | 开始计时 |
func (b *B) StopTimer() | 停止计时 |
func (b *B) SetBytes(n int64) | 设置每次操作处理的字节数,用于计算每秒处理的字节数 |
四、性能分析工具(pprof)
Go语言内置的性能分析工具,用于分析Go程序的CPU使用情况、内存分配、阻塞操作等。
1.基本使用
使用该工具需要在程序的初始化部分导入pprof包
import _ "net/http/pprof"为了能够访问pprof提供的分析数据,需要启动一个HTTP服务器
package main

import (
    "log"
    "net/http"
    _ "net/http/pprof"
)

func main() {
    go func() {
        if err := http.ListenAndServe(":6060", nil); err != nil {
            log.Fatal(err)
        }
    }()

    // 程序逻辑

    select {}  // 保持程序运行
}
2.性能分析
启动程序后,可以在浏览器中访问以下 URL 来查看不同类型的分析数据
- http://127.0.0.1:6060/debug/pprof/:pprof的概览页面。
- http://127.0.0.1:6060/debug/pprof/goroutine:当前所有goroutine的堆栈跟踪。
- http://127.0.0.1:6060/debug/pprof/heap:内存分配情况。
- http://127.0.0.1:6060/debug/pprof/threadcreate:线程创建情况。
- http://127.0.0.1:6060/debug/pprof/block:阻塞操作情况。
- http://127.0.0.1:6060/debug/pprof/profile:CPU 分析数据(默认 30 秒)。
3.详细分析
a.采样
在程序运行过程中,可以通过curl命令将分析文件保存到本地
curl http://localhost:6060/debug/pprof/profile?seconds=30 > cpu.profcurl http://localhost:6060/debug/pprof/heap > heap.profcurl http://localhost:6060/debug/pprof/goroutine > goroutine.profcurl http://localhost:6060/debug/pprof/mutex > mutex.profcurl http://localhost:6060/debug/pprof/block > block.profb.分析
在捕获分析文件后,使用 go tool pprof 指令进入交互界面分析
go tool pprof xxx.profc.分析指令
具体可用指令:
top: 显示占用系统最多的函数list [regex]: (根据正则表达式)显示特定函数详细信息web: (需要Graphviz支持)生产图形化报告并在浏览器打开
top:指令相关指标与含义
| 指标 | 含义 |
|---|---|
| flat | 当前函数本身的执行耗时 |
| flat% | flat占CPU总时间的比例 |
| sum% | 上面每一行的flat%的总和 |
| cum | 当前函数加上其调用函数的总耗时 |
| cum% | cum占CPU总时间的的比例 |
d.网页分析
在程序运行过程中,直接通过以下命令即可打开网页进行分析(需要Graphviz支持)
go tool pprof -http=:8080 "http://localhost:6060/debug/pprof/profile?seconds=10"go tool pprof -http=:8080 "http://localhost:6060/debug/pprof/heap"go tool pprof -http=:8080 "http://localhost:6060/debug/pprof/goroutine"go tool pprof -http=:8080 "http://localhost:6060/debug/pprof/mutex"go tool pprof -http=:8080 "http://localhost:6060/debug/pprof/block"